

Recent Case Studies
Review of the spill risk analysis in the DEIS for Cook Inlet Lease Sale 258
Completed December 2021
Client: Earthjustice

The a. cumulative expected number of large spills that may occur due to oil production in Cook Inlet and b. probability that at least one large spill occurs increase as more projects are approved.
The Cook Inlet Lease Sale 258 DEIS predicts that there would be 410 small (<42,000 gallons) spills of crude oil, refined oil, and condensate over 40 years.
I considered five fundamental questions about the spill impacts addressed in the Cook Inlet Lease Sale 258 DEIS:
1. Does the oil spill risk analysis (OSRA) methodology make sense?
2. What are the implications of the OSRA?
3. What if local data were used to estimate spill rates, especially for spills <1,000 barrels (42,000 gallons)?
4. Given the amount of present and reasonably foreseeable future actions related to oil development in Cook Inlet, how many small and large spills might be predicted under different development scenarios?
5. Are the characterizations of spill impacts as shown in the DEIS supported and sufficient to inform the reader of the risks associated with oil production in Cook Inlet?
Data from Cook Inlet show that, under Lease Sale 258's expected production of 0.1923 BBO, >2,070 spills are predicted, potentially releasing >160,000 gallons, including hazardous and extremely hazardous substances in addition to crude oil, refined oil, and condensate. Even if individually those small spills may have little impact, the repeated nature and potentially compounding effects of various hazardous materials being added to the environment should not be underestimated. Furthermore, Lease Sale 258 is only one component of offshore development in Cook Inlet. As the amount of oil produced increases, so do the spills risks and other environmental impacts.
Alaska mining spill retrospective
Completed November 2021, released April 2022
Clients: Brooks Range Council, Earthworks, National Parks Conservation Association, and the Tanana Chiefs Conference

The full report is available.
Alaska has a long history of hard rock mining. In this analysis, Elemental Statistics compared the spill risks presented in the permitting documents from Pogo, Kensington, Greens Creek, Fort Knox/True North, and Red Dog mines with the records in spill databases from the Alaska Department of Environmental Conservation, the Coast Guard National Response Center, and the Pipeline and Hazardous Materials Safety Administration.
This report had the following objectives:
Assess what spill risks are addressed in the permitting documents
Use a consistent quantitative model for estimating the number of spills predicted and the probability of at least one trucking accident spill for all hazardous materials
Compare actual spills to predicted numbers
Offer model critiques
Identify data gaps
Synthesize the findings and make recommendations for the environmental review process for proposed new mines and mine expansions
A comprehensive spill risk analysis is an essential part of the permitting process to provide accurate information to decision-makers and the public about the potential social and environmental impacts of a proposed mining operation and associated infrastructure. The EIS process must include a quantitative spill risk assessment that includes the potential for all on-site and transportation-related spills and considers the full range of hazardous materials.
Alaska oil and gas industry spill impacts on polar bears and walruses
Completed June 2021
Client: Defenders of Wildlife

The North Slope of Alaska has a long history of spills of multiple types of substances, including crude and refined oil, extremely hazardous and hazardous substances, and process water. a. There were more than 9,900 spills related to the oil industry recorded on the North Slope from 1995-2020 in size and substance categories not considered in the spill risk analysis. b. Excluding these spills means the proposed ITR ignored a spill record of more than 72,400 barrels.
As part of the permitting process for being allowed to work in the Beaufort Sea and surrounding land areas, several oil and gas companies needed to describe the potential impacts on walruses and polar bears, including those from hazardous materials spills.
The companies submitted an oil spill risk analysis (OSRA) that only modeled the potential trajectories of spills of >1,000 barrels of crude oil from 11 potential launch areas and five hypothetical pipeline locations in the Beaufort Sea.
Spills of crude less than 1,000 barrels and all other substance spills were not considered, even though more than 9,900 such oil industry spills have occurred on the North Slope from 1995-2020, releasing more than 72,400 barrels of crude oil, refined oil, hazardous and extremely hazardous substances, and process water (Figure).
The OSRA showed that six different environmental resource areas used by polar bears and/or walruses have at least a 10% chance of a crude oil spill reaching them from one of the spill origins considered in the modeling, as do multiple land segments and grouped land segments.
Nine of the 11 modeled launch areas and four of the five hypothetical pipelines resulted in a 10-50% chance of crude oil reaching polar bear and/or walrus habitat.
The OSRA explicitly does not estimate the number or probability of a large crude spill (or any other spills). Such an estimate would require knowing the spill rate (per quantity of oil produced, number of wells, or miles of pipeline) and the associated estimated amount of production and/or infrastructure (the exposure variable).
The covered parties did not give a full list of their exposure variables, individually or collectively, making it impossible to estimate the number of spills that could be seen on- or offshore, in any size class, and of any hazardous materials.
The Alaska Department of Environmental Conservation spills database shows that there have been more than 10,000 spills in sizes ranging from 0-995,400 gallons of crude and refined oil, process water, and hazardous and extremely hazardous substances on the North Slope from 1995-2020. Less than 10% of those spill incidents were of crude oil.
Until all the spill rates of different sizes, substances, and locations are calculated using up to date data and coupled with complete and relevant exposure variables for the component ongoing and planned activities, the analysis of spill risks described in the proposed rule for incidental take does not address the true threats to walruses and polar bears.
Stibnite Gold Project transportation corridor spill risks
Completed October 2020
Clients: Idaho Conservation League and Advocates for the West

Comparison of probabilities of at least one spill of a hazardous material from trucks from a. the ~70 mile roadway from SH-55 to the proposed mine site and b. the transportation corridor estimated using the reagent origins, including the ~70 miles shown in part a. Solid curves are for Alternatives 1, 3, and 4. Dashed curves are for Alternative 2. The blue curves use the 2009-2017 average spill rate, the orange curves use the 2017 spill rate, and the green curves use the spill rate cited in EPA (2014). The black horizontal lines separate the probable, possible, and unlikely probability ranges, based on USACE (2012).
The Stibnite Gold Project (SGP) will require large quantities of more than 30 different hazardous materials being transported to and from the mine site in thousands of heavy truckloads each year. Those hazardous materials include fuels, explosives, acids, and toxic materials, but the dangers posed by the reagents are not discussed.
The SGP DEIS had inconsistent descriptions of the reagents to be used and the number of trips of hazardous materials trucks would require and multiple arithmetic errors.
The transportation corridor analysis area did not consider any risks beyond Cascade, Idaho.
EISs for other mines include spill risk rates that are on the order of 2.0 x 10⁻⁷ spills per truck-mile, but the SGP DEIS estimated a spill rate ranging from 1.4-1.9 x 10⁻⁹ spills per truck-mile, which is two orders of magnitude lower than rates published in multiple sources.
Using a spill risk rate of 1.6 x 10⁻⁷ spills per truck-mile, I found that probabilities of spills and accidents range from possible to probable (if not certain) for all Action Alternatives for the analysis area considered in the SGP DEIS and the full length of the transportation corridor (Figure).
Without an accurate characterization of the true exposure along the transportation corridor and the spill rate per truck-mile, it is impossible to make informed statements about spill likelihood and the potential consequences to the environment and to public safety.
Overall, the analysis of the potential impacts from hazardous materials in the SGP DEIS is inadequate to make an informed decision.
Pebble Mine fish habitat
Completed August 2020
Client: Wild Salmon Center
Co-author: Gordon Reeves

Photo by S. Lubetkin, July 2019
The fundamental question underlying the fish habitat assessment for the proposed Pebble Mine is:
How will fish (specifically seven species of interest at defined life stages) respond if Pebble Mine permanently changes the flows in the streams around the mine site?
The US Army Corps of Engineers (USACE) and Pebble Limited Partnership (PLP) ask the reader to believe that the streams in the vicinity of the Pebble deposit will be better suited to producing fish if they had less water and less variability in flow magnitudes than they do without the mine. The USACE and PLP used a complicated and interconnected set of models (surface water and groundwater models, PHABSIM, and HABSYN) to address this, each with serious methodological weaknesses or flaws in execution.
• The surface water model that is the linchpin of all further flow modeling does not predict flows based on precipitation precisely. There are competing and fundamentally different groundwater models in different portions of the overall water modeling effort that even the authors of the EIS do not understand.
• PHABSIM was developed by scientists and managers with no background in ecological or environmental modeling 40 years ago. It is based on outdated concepts and techniques, and was never subjected to fundamental, rigorous peer review during its development.
• Even if PHABSIM were a defensible model, the requirements for getting the most accurate results from it were not met by the sampling conducted on the three streams, either in transect placement or in the range of flows sampled.
• PHABSIM was modified into the proprietary and unvetted model HABSYN, which theoretically gave a greater degree of spatial resolution by extrapolating from 143 transects with depth, velocity, and substrate observations to 1,977 habitat units where no observations had been taken.
• HABSYN was used at two different time steps (monthly and daily) with different hydrology periods (1942-2017 and 2005-2014). The results of the model were not consistent across the two runs.
The end result of PLP’s PHABSIM/HABSYN modeling effort is an attempt to use a tier of poorly designed models that do not work well together to show that permanent and often significant reductions in streamflow will not decrease the quantity or quality of fish habitat in the NFK, SFK, and UTC. In short, there are flaws and limitations of each component in that analysis and their characterization of the effects of the proposed Pebble Mine on fish habitat are scientifically and statistically unsound.
Pebble Mine spill risk analysis
Completed August 2020
Client: Wild Salmon Center
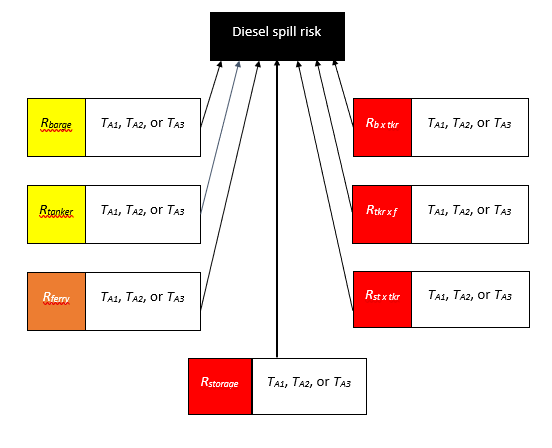
This conceptual diagram of the fault tree model of the overall spill risk for diesel along the transportation corridor includes risks from marine barges (Rbarge), tanker trucks (Rtanker), the ferry (Rferry), and storage facility leaks (Rstorage), and transfers between those (Rb x tkr, Rtkr x f, Rst x tkr) and the associated amount of use in each of the three Alternatives (TA1, TA2, and TA3 for each step along the transportation corridor). Not all transfers are shown in this diagram. Risks in yellow were modeled quantitatively for the EIS. The risk in orange were discounted from quantitative modeling after comparison to other spill risk rates. Risks in red were not quantitatively discussed or evaluated in the PLP EIS.
This analysis was a review of the spill risks associated with the transportation corridor and potential releases from tailings storage facilities. The release scenarios considered in Pebble Limited Partnership’s (PLP’s) Final EIS were limited to a small subset of spill sizes, substances, and sources.
My review of the transportation corridor considered the quantities of diesel, ore concentrate, ore concentrate slurry, and reagent movement via trucks, barges, and pipelines in light of historical spill data from Alaska. (The image is the fault tree for potential diesel spills. Similar diagrams can be made for ore concentrate and mine reagents. See Case Study #2 in Lubetkin (2020) for details.)
I also applied basic rules of probability to the results of PLP’s tailings storage failure modes and effects analysis.
The annual risk probabilities and consequences for the potential failure modes analyzed at a Failure Modes and Effects Analysis (FMEA) workshop were “semi-quantitative” and “subjective”, rather than analytical or based on calculations or statistics. Those ratings did not include confidence levels about the workshop’s assessments.
There are 90 potential failure modes considered across the water management pond, the north and south embankments of the pyritic tailings storage facility, the bulk tailings storage facility, and the bulk tailings storage facility post-closure that could result in a partial or full breach. To avoid a breach, none of those 90 failure modes can occur over the project lifetime.
Breaches from any of the structures could release anywhere from less than 1% of the volume to 100% of the volume. The three release scenarios modeled – one of which was not a breach but a pipeline rupture – only considered the environmental impacts of releases of less than 1% of the potential volume. Actual partial and full breaches could release much higher quantities than those described in the FEIS with much more harmful consequences.
The FMEA workshop resulted in estimated annualized failure rates for each potential failure mode. Using basic rules of probability, the probability of success (that is, not one of the potential failures modes occur) can be calculated for each structure for a year. Those annual success probabilities can then be combined to find the probability that none of the structures have a breach in one year or over any specified length of time.
SPOT offshore oil terminal in the Gulf of Mexico
Completed March 2020
Client: Earth Justice

Graphical comparison of two spill rate estimates for the same hole diameters for the same isolatable segments of the proposed SPOT project on a) a linear scale and b) a log-log scale to allow the individual estimates more visual separation at the smallest spill frequency estimates. If the ERM (2020) and Risknology (2019) estimates for the same isolatable section and hole diameter match, they would fall on the 1:1 line. The more they differ from that line, the less confidence we have in at least one of them.
The Sea Port Oil Terminal (SPOT) Deepwater Port Project draft EIS used two models to analyze oil spill size, frequency, and fate. I analyzed both models for consistency of their inputs, assumptions, and results, and for technical flaws. The expected spill frequencies at various hole diameters from the two models were substantially different from one another (Figure).
The SPOT DEIS fate modeling exercises used an offshore spill volume based on a Bureau of Ocean Energy Management (BOEM) (2012) estimate of 2,200 bbl as a median large offshore spill volume. This value is unjustified because it only used data from 1996-2010, which is both too short a time frame for characterizing the size and frequency of large spills and does not use current spill data. When data from 1972-2017 are used and volumes from spills caused by the same hurricane are aggregated, the median spill size (n = 31 spills >1,000 bbl) is 3,489 bbl.
I coupled spill data and estimates of spill rate from BOEM with estimates of the volume of oil that would be handled at the terminal to find the number of spills expected in four different size classes.
The worst case scenario presented in the DEIS used 30 minutes for the shut down time in the event of a subsea release. I calculated volumes of oil released for various shut down times from 0.5 to 48 hours.
Offshore oil spill risks in the Beaufort and Chukchi Seas

Fault tree models for oil platforms and pipelines in the Arctic used by BOEM and my critiques